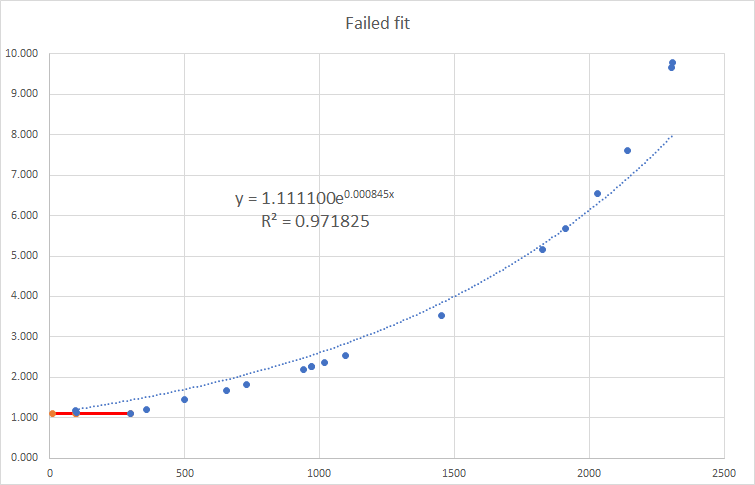
In part 3 we learnt that maximum decay happens after 72 hours. This means that we have one fixed point on our curve – 10 CP and 1.11%. But unfortunately even while it looks and feels like an exponential algorithm we still can’t get a good fit.

There are two issues why we can’t fit a simple function to this beautifully looking curve.
The first issue is that we think like the player, not like the game designer. We ant to know the decay per hour to calculate the remaining motivation after x hours. But 1.11% is unlikely a value that the game designer would have used. Instead of 1.11% to 10% we should plot 8 hours to 72 hours on our y axis.
The second point is more subtle. The slope of our curve is too steep to stop at 1.11%. We already know that there is an upper limit around 2320 where we get a fixed decay of 10%. We therefore shouldn’t be surprised that there is also a lower limit below which we get a fixed decay of 1.11%. At this time I estimated the lower limit at around 300 CP. To make it more obvious I added a point at 300 CP and 1.11% as well as a red line indicating a discontinuous function.

The fit looks fantastic – but I warned earlier that we should look out for over fitting. So can we make sense of the algorithm?
-31.31 ln(CP) looks weird. But knowing some advanced Maths we can transform this into a much nicer looking 72.09 log10(CP). We earlier discovered that it takes a maximum of 72 hours until full decay for any Pokemon – no matter how weak. It therefore seems save to just round the value to 72 hours.
What about the 250.64? Can’t we just round it to 250 hours and get the final algorithm as
Time until full Motivation Decay = 250 hours – 72 hours times log10 (CP)
Unfortunately I believe that the correct and final answer is
Time until full Motivation Decay = 250.35 hours – 72 hours times log10 (CP)
In part 5 I will explain how I found the value of 250.35 hours – and why it makes a lot more sense (for a game developer) to use this value and not 250 hours.