Yesterday was emotionally draining but also very rewarding. I unveiled my blog on the SilphRoad Reddit. This is a great place to reach lots of readers – but also an unforgiving place as you always invite trolling if you dwell about Maths and the finer points of an analysis.
Just before posting I realised that someone else had produced a fantastic set of data and already discovered the lower bound of 300 as well as pretty accurately defined the upper bound (Article by u/Kaukasiertje with Great Decay Data)
But in the end it is peer review and feedback that drives science forward and that either confirms it, replaces it with an improved version or rejects it.
The most useful feedback for me came from Brandon Enright. He not only rewrote my equation in a nicer format (I still contemplate which version I use for my next post) eliminating the ugly 250.35 – he also generated a great plot to verify the equation.
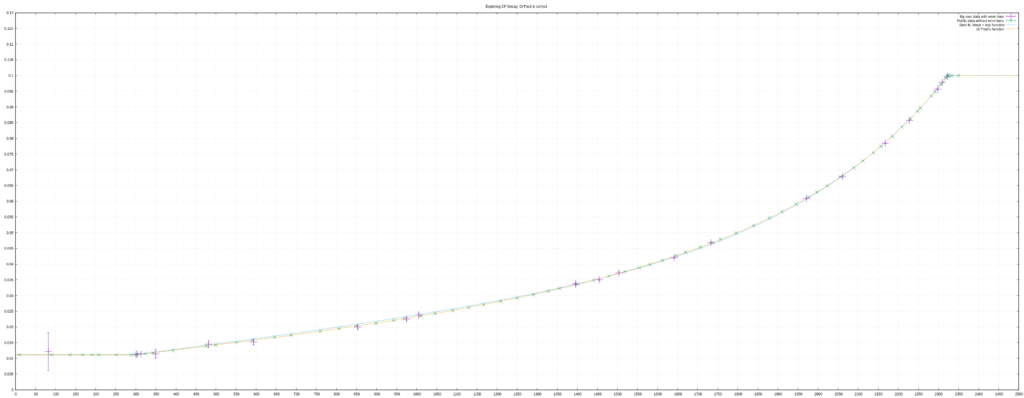
You will have to zoom in to dwell on the finer details. For practical purposes the blue line is more than accurate enough if we want to predict the decay. But it is the lack of any systematic difference across the whole curve that is important – no matter how small.
Thanks for generating the plot and I hope Brandon you are okay that I use it here before waiting for your reply.
Oh excellent, I hadn’t realized you’d made a follow-up post until today. I have no problem with you re-using any plots I make. With few exceptions, I generally consider almost everything I post on the internet to be public domain 🙂
I’m just sorry I generated the plot for such a high resolution because it scales poorly.
Comments are closed.