Just over a week ago I helped answer a question on the SilphRoad about motivation and berry feeding. This let me re-investigate the state of motivation decay and I realised several issues in the process:
- I had written a blog post myself about berry feeding. Unfortunately it is well hidden and out of date (no Silver Pinap berries, no remote feeding)
- No convincing formula for the motivation decay was ever published
- The most accessible data on the web about motivation decay (see Gamepress Gym Motivation what you should know ) is of unknown quality
I always contemplated to do a blog myself – so here finally it is.
I make some bold statements. Can I back them up?
I value Gamepress a lot as a solid source of information for Pokemon Go. Unfortunately the data shown in the article I link to was my first generation data I published on the SilphRoad. The data isn’t wrong. But a single data point is of limited quality and it lacks the necessary spread. I can say convincingly that it is impossible to generate an accurate algorithm for the decay of motivation from that data – because by now I found a convincing formula.
But first a step back. I titled the blog data quality. Good data needs to be fit for purpose. In this case the data was good enough to show convincingly a decay rate of 10% above a certain combat point threshold. At first glimpse it seems to indicate an exponential link between decay rate and CP. But fitting an exponential function never actually works. So what is wrong?
Better data might shed a light on that. So what is the issue with gathering high quality data for decay? After all this is just gathering a time and a map it versus a value? But there are some practical issues we need to overcome:
- Screenshots (iPhone) and in game time are in minutes.
- Raids interrupt the motivation decay
- Interactions with the gym (berry feeding/attacks) invalidate a data series
A game time of minutes seems not too bad. Taking a reading after two hours should give us an error of <1%. For a lot of data this seems accurate enough. But this misses the issue that a high CP Pokemon will lose several CP per minute in motivation.
Low CP Pokemon don’t suffer from the time inaccuracy that much – but they are affected by issues 2 and 3. We need data over multiple hours without any raids (or timing the raids and deducting the time from the total)
Using an external stop watch seems an alternative – but it makes data gathering a lot more cumbersome. So I opted for a more precise ‘clock’ that at the same time also automatically stops during raids – a second Pokemon.
So how does this work? I take it as granted that the motivation decay for a Pokemon with CP > 2400 is exactly 10%. This means I can use the displayed CP of a high powered Pokemon as my clock – gaining around a factor 4-6 in my precision of the time.
Knowing the max CP of each Pokemon in a gym allows me the calculate the remaining motivation from each screen shot. All I need then to do is plot the data and do a linear regression. Presto – I have high quality data – hopefully good enough to use for my purpose.
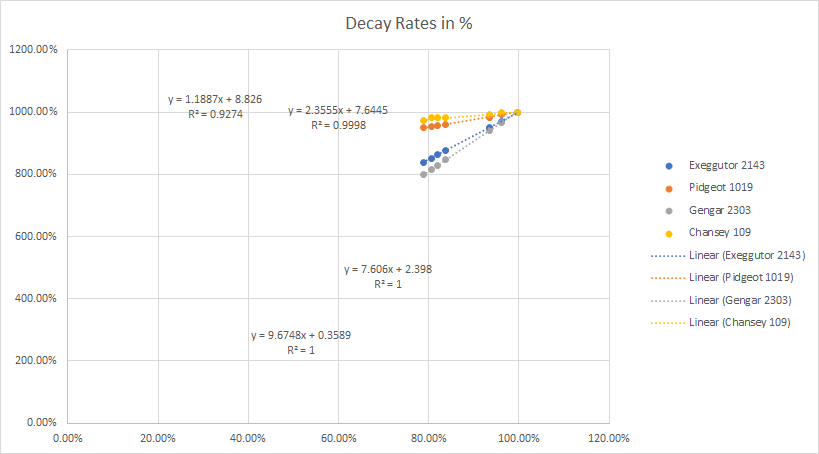
The graph shows my first proof a concept data gathering. I use a 2963 CP Gyarados as my reference. I am cheating by using 10 x motivation for all the Pokemon apart the reference. This gives means the slope of my trend line is exactly my hourly decay (in %).
The first data gathering was cut short as the gym got attacked after around 2 hours. But it was enough as a proof of concept.
| Pokemon | CP | Decay | StDev | Predicted |
| Gyarados | 2963 | 10% | na | 10% |
| Gengar | 2303 | 9.675% | 0.011% | 9.668% |
| Exeggutor | 2143 | 7.606% | 0.008% | 7.600% |
| Pidgeot | 1019 | 2.355% | 0.014% | 2.369% |
| Chansey | 109 | 1.189% | 0.149% | 1.111% |
Here is the data in table format. We can see that the Chansey data is quite inaccurate. The data is also enough to bury already one possible hypothesis I was following up at the time – the decay per hour is not e to the power of (CP/1000). The Gengar is close to 10% (a 2302 CP Pokemon would be exactly 10% if this would be the right algorithm) but 30 stdev means this can’t be the right one.
In part 2 I will investigate how a single data point can alter a perception completely – stay tuned.
Eagle eyed readers might notice that I also added a predicted decay column. Yes – I claim I cracked the motivation formula. I encountered two unexpected issues on my quest for the algorithm and the final algorithm therefore will be revealed as part 4.