I guess many players at some stage will have investigated drop rates. I started to collect my own data – when I found other having done a much better job before me. This analysis is based on the data of Philip Kloppers who did 4000 consecutive glyph hacks. This is a treasure trove for a data-miner and statistician. There are several findings from me in this data and my own – but I wanted to start simple.
As SilphRoad Researcher for Pokémon Go I was known as Mr. Ratio. The best known one I discovered was the 1:2:4:8 ratio for Pokémon rarities and egg tiers. There are several other ratios I discovered – some not even published yet. It therefore was obvious for me to investigate such ratios in the dataset from Philip.
Sometimes all it takes is to present data in a different way to make it obvious. These are the raw counts for each level of portal hacked and the level of resonators resulting from the hack. This data does exclude any bonus hacks.
| Portal | R lvl-1 | R lvl | R lvl +1 | R lvl +2 |
| 1 | na | 853 | 98 | 18 |
| 2 | 140 | 669 | 67 | 18 |
| 3 | 114 | 652 | 57 | 13 |
| 4 | 205 | 952 | 113 | 20 |
| 5 | 90 | 347 | 39 | 11 |
| 6 | 87 | 497 | 52 | 14 |
| 7 | 35 | 173 | 22 | na |
| 8 | na | na |
Now the same data normalized
| Portal | R lvl-1 | R lvl | R lvl+1 | R lvl+2 |
| 1 | na | 88.0% | 10.1% | 1.9% |
| 2 | 15.7% | 74.8% | 7.5% | 2.0% |
| 3 | 13.6% | 78.0% | 6.8% | 1.6% |
| 4 | 15.9% | 73.8% | 8.8% | 1.6% |
| 5 | 18.5% | 71.3% | 8.0% | 2.3% |
| 6 | 13.4% | 76.5% | 8.0% | 2.2% |
| 7 | 15.2% | 75.2% | 9.6% | na |
I mentioned earlier that Pokestop drop items in fixed ratios. If you can’t spot them from the data above, then I will make it easier for you
| R lvl-1 | R lvl | R lvl+1 | R lvl+2 | |
| Ratio | 8 | 40 | 4 | 1 |
| Predicted | 8/53 | 40/53 | 4/53 | 1/53 |
| Predicted | 15.1% | 75.5% | 7.5% | 1.9% |
It helps to have an independent test set. Here is the data analysed for the bonus hacks:
| Portal | lvl -1 | lvl | lvl +1 | lvl +2 |
| 1 | na | 1325 | 121 | 37 |
| 2 | 221 | 1247 | 134 | 34 |
| 3 | 283 | 1349 | 134 | 34 |
| 4 | 436 | 2206 | 237 | 49 |
| 5 | 156 | 760 | 79 | 20 |
| 6 | 272 | 1274 | 131 | 28 |
| 7 | 96 | 496 | 62 | na |
| 8 | na | na |
And normalized
| Portal | lvl-1 | lvl | lvl+1 | lvl+2 |
| 1 | na | 89.3% | 8.2% | 2.5% |
| 2 | 13.5% | 76.2% | 8.2% | 2.1% |
| 3 | 15.7% | 74.9% | 7.4% | 1.9% |
| 4 | 14.9% | 75.3% | 8.1% | 1.7% |
| 5 | 15.4% | 74.9% | 7.8% | 2.0% |
| 6 | 16.0% | 74.7% | 7.7% | 1.6% |
| 7 | 14.7% | 75.8% | 9.5% | na |
A simple ratio of 8:40:4:1 can explain the observed data pretty well. But the data was from 2015. Is it still meaningful?
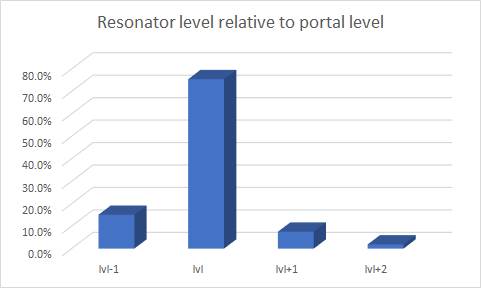
And the same as a nice graph above.
Here is my own new data that shows nothing truly changed.
| Portal | R lvl-1 | R lvl | R lvl+1 | R lvl+2 |
| 1 | na | 148 | 13 | 2 |
| 6 | 19 | 106 | 11 | 1 |
| 1 | na | 91% | 8% | 1% |
| 6 | 13% | 75% | 8% | 1% |
Taking into account my very limited set (compared to Philip) it seems close enough to assume that the ratios in level of resonators dropped still follows the same rules.
Still not convinced? There is an even older data set with some 400K rows (reference to be added here). The layout of the table is inverted. Only level 2-6 is shown.
| Relative level | Weight | Theory | A <> A found | A<>A percent | R<>R found | R<>R percent |
| -1 | 8 | 15.2% | 2189 | 15.5% | 6458 | 14.8% |
| 0 | 40 | 76.2% | 10667 | 75.4% | 32602 | 74.7% |
| +1 | 4 | 7.6% | 1157 | 8.2% | 4082 | 9.3% |
| +2 | 0.5 | 1.0% | 129 | 0.9% | 525 | 1.2% |
The 8:40:4 ratio can also be observed. But the +2 level drops seem to have been doubled since the very, very early. This dataset splits the data in Aliens<>Aliens and Resistance<>Resistance.