In the age of AI and automated data-mining a lot of readers might think all it takes is a good statistical fit to ‘proof’ that you found the right correlation. I stumbled upon a very interesting article on the BBC webpages just when I contemplated to start this blog AAAS: Machine learning ‘causing science crisis’ .
Below is a snapshot from me working on the motivation decay algorithm:
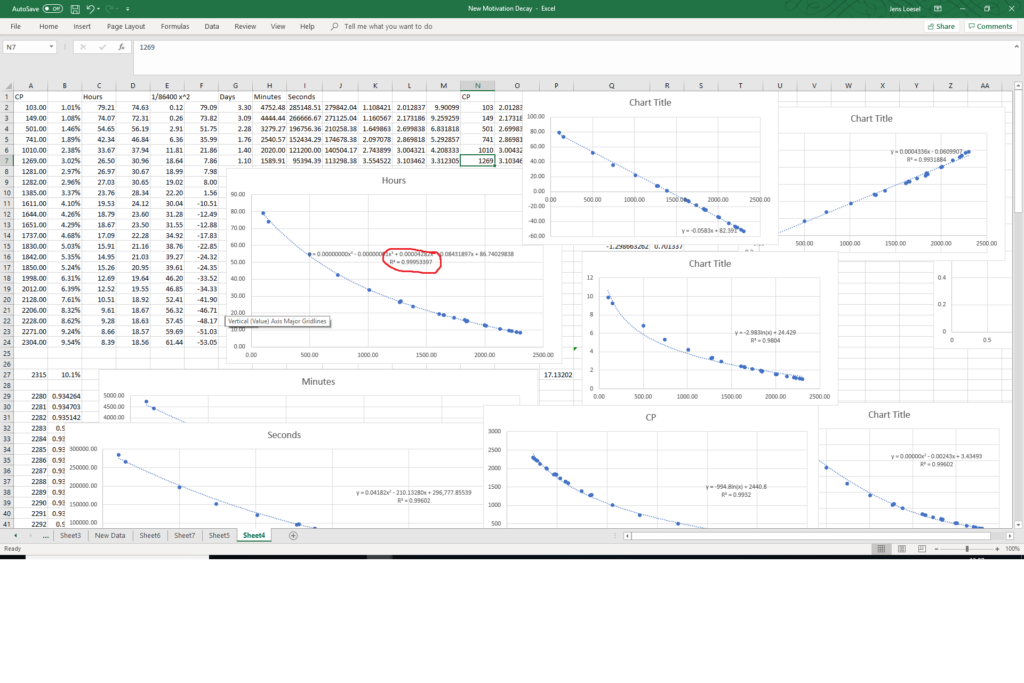
All of the graphs show different attempts to find a good correlation. The circled number is an R^2 value of 0.9995 – lots of others are >0.99. So why did I disregard all of these models and never published them / carried on researching the ‘true’ algorithm?
- I can’t explain them
- Raising the complexity of a model to raise the statistical fit is bad
With hindsight some of the models actually were pretty close to the real solution. Only a few ‘minor’ issues in my training data prevented me from finding the correct solution.
- A single data point – CP 103 is off by 10% (1.01% instead of 1.11%) – I will deal with this in Part 3
- The actual algorithm is discontinuous – meaning there is no single function for the whole area. I will deal with this in Part 4.
- I’m missing data around the discontinuation point (lack of data between CP 250- 350). I will deal with this in Part 5