What happens if we approach it from the Ingress point of view?
| Indications and clues | The data we have |
| Niantic announcement – colors linked to Ingress factions | Plus, as part of the celebration, Trainers will have an opportunity to encounter two Shiny Pokémon that have colors matching Ingress Prime’s factions—Shiny Ponyta, which has bright blue flames, and Shiny Cubone, which has a green body! |
| Interpretations just after the announcement | Nintendo Soup wrote: During the Ingress Prime in-game event, trainers will be able to catch a Shiny Cubone and blue Ponyta. Shiny Cubone represents the green faction, while blue Ponyta represents the blue faction in Ingress Prime. |
| Ingress has two factions – but ownership is not random like a coin-flip | We would expect a difference from a 50:50 ratio. Anything between 40:60 up to 60:40 seems believable – with largelocal variations. |
| There is a third Ingress faction – not belonging to either faction | This would include a unboosted shiny drop rate in some areas of either 1 in 500 or zero.. |
Assuming a 1 in 25 rate we can work backwards and calculate shiny checks near Enlightened Portals, Resistance Portals and neutral/no portals.
| Pokémon / Owner | Overall rate | Local rate | Portals |
| Cubone/Enlightened | 1 in 120 | 1 in 25 | 21% |
| Ponyta/Resistance | 1 in 162 | 1 in 25 | 15% |
| No shiny/No faction | No shiny | No shiny | 64% |
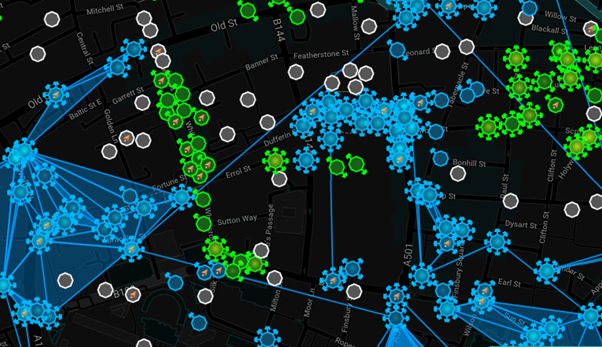
This values just seemed wrong when I calculated them the first time. The area not owned by anyone seemed just too high. Here is a snapshot of portal ownership from a random area near central London, UK
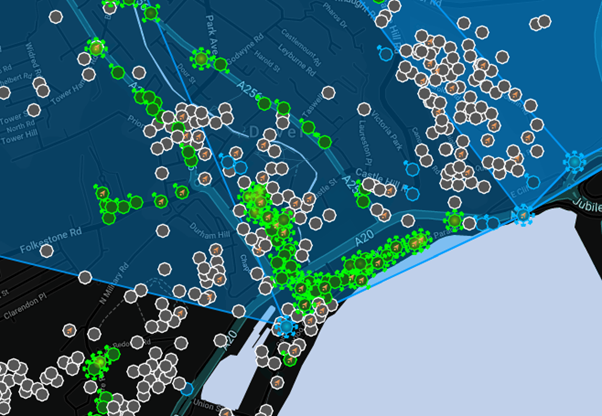
But this could look pretty different if you look at a place like Dover. UK closer to me.
A rate of 64% without shiny is not inconceivable if we also assume that there are areas where you can catch Pokémon with no portals nearby at all. An interesting question would be – could you get shiny Cubone/Ponyta from incense. It is unlikely that we will be able to find out if that is the case so much later. Maybe next Ingress Day.
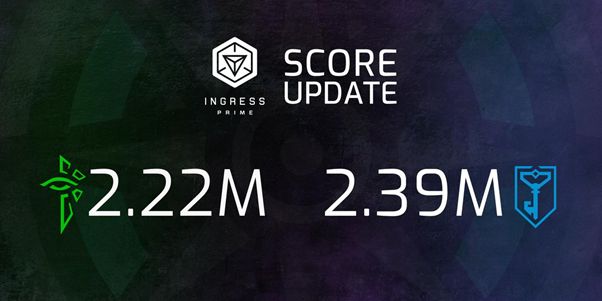
Two more datapoints of interest: According to an interview with John Hanke in Mashable https://mashable.com/2016/07/10/john-hanke-pokemon-go/?europe=true#ISe.1_iTtkqf there were 5 million portals worldwide approved in 2016. But the latest event only yielded the following total numbers of portals hacked by the different factions over a time frame of 1 week:
These numbers seem off – but it means 64% of checks in no shiny dead zones is conceivable.
Another issue I struggled for a while was that shiny Cubone seemed more prevalent as shiny Ponyta. Ingress keeps a score about each faction and this score is updated every 5 hours. I quickly learned that these scores are not accurate description of overall portal ownership. I managed to reach the top of the local leaderboard in my first two weeks of play. Playing in the right area and generating large fields is more important for the score than owning a whole town of portals.

Probably the easiest would have been to ask players where they got their shiny and map it to Enlightened and Resistance ownership. I started this and initial anecdotal information seemed reassuring. But there were several reasons why this wasn’t followed up.
- I had started to analyze SilphRoad Research Data and it is frowned upon to make any hypothesis public prior to publication – which makes it impossible to launch a reddit questionnaire
- I still didn’t know enough about Ingress and how the game worked. Originally, I tried to map S2 cells of various sizes and fields. It took me a while to realize this would not work and instead data had to be controlled on a portal/Pokestop level.
- I got sucked into playing Ingress and suddenly playing seemed more interesting as spending hours behind my screen analyzing and writing
As I said – the little data I gathered seems to be in line with the hypothesis. But it is way too little to be convincing on its own.
Sometimes it helps if you just wait. The Dark XM event in Ingress asked all players to capture an additional 400k portals above the base line. I do not encourage the use of scraping bots in any way and think they do way more harm then good. But they certainly are superior in gathering data and I’m the last to ignore such data when it is publicly accessible.
The following graph circulated during the Dark XM event. It shows the number of Resistance, Enlightened and neutral portals during the event.
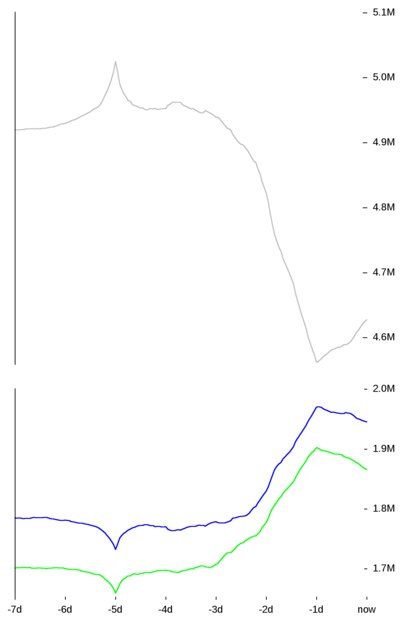
The same data in table format. I round generously and use the baseline at the start of the event.
| Owner | Portals | Percent |
| Resistance | 1.8 million | 21% |
| Enlightened | 1.7 million | 20% |
| Neutral | 4.9 million | 58% |
These numbers are surprisingly in line with what I calculated they would need to be. There are some flaws and assumptions here if I compare them 1 on 1. This is no proof that I’m right. But that was not my intention. All I wanted to show is – they are in the right ball park, so my hypothesis could make sense.