In part 4 I outlines why it is important to look at individual slices of the data as lumping all together would diminish the signal.
I generated a few graphs where I calculate the expected values based on a binomial distribution.
I use 4 different models. The first is a flat rate of 1 in 139 (that is the overall average of shiny found). I then use a combined rate of 50% players having a 1 in 50 chance and 50% have a 1 in 500 chance. And then I show the 1 in 50 chance and 1 in 500 chance.

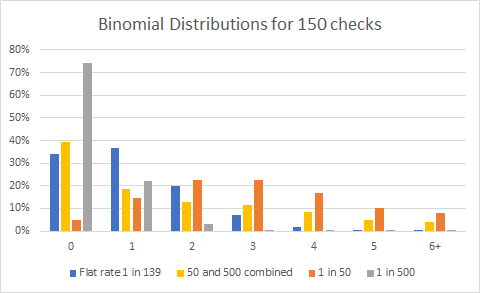
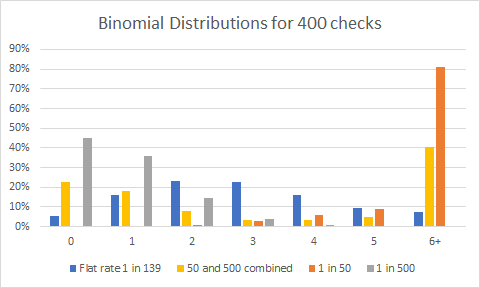
This is more or less the same as the table in part 4 but with calculated values and some pretty graphs. The take away from these graphs is: the peaks for most likely number of Pokemon found is at different values depending on model. Only one model results in 2 peaks – given sufficient data.
There is even a simple test to check a fit – the chi square test. I will use that in the next part to look at the statistical fit.