Looking backwards is always easy – it is looking forward and making predictions which show if your algorithm does work or might be fundamentally flawed. I discarded all my original data when I revisited the motivation decay as I couldn’t tell how accurate they have been. So now is a good time to revisit this ‘discarded data’ and seen how well we do. We could have a philosophical discussion how well this qualifies as independent test set – but maybe have a look the data first:
My generation 1 data (see also GamePress)
| Max CP | Decay Percent Per Hour | Decay calc. | T(max) | T(max) calc |
| 104 | 1.37% | 1.11% | 58.39 | 72 |
| 741 | 1.89% | 1.83% | 42.33 | 43.72 |
| 1010 | 2.38% | 2.35% | 33.61 | 34.04 |
| 1281 | 2.97% | 3.01% | 26.94 | 26.61 |
| 1282 | 2.96% | 3.01% | 27.03 | 26.58 |
| 1611 | 4.10% | 4.12% | 19.51 | 19.44 |
| 1644 | 4.26% | 4.25% | 18.78 | 18.81 |
| 1651 | 4.29% | 4.28% | 18.65 | 18.67 |
| 1737 | 4.68% | 4.68% | 17.09 | 17.08 |
| 1830 | 5.03% | 5.18% | 15.90 | 15.45 |
| 1850 | 5.24% | 5.29% | 15.27 | 15.11 |
| 1998 | 6.31% | 6.30% | 12.68 | 12.71 |
| 2012 | 6.39% | 6.41% | 12.52 | 12.49 |
| 2206 | 8.32% | 8.32% | 9.62 | 9.61 |
| 2228 | 8.62% | 8.60% | 9.28 | 9.30 |
| 2315 | 10.10% | 9.87% | 7.92 | 8.10 |
| 2335 | 9.98% | 10.00% | 8.02 | 8 |
| 2597 | 9.97% | 10.00% | 8.02 | 8 |
| 2874 | 9.96% | 10.00% | 8.03 | 8 |
The calculated values actually are a lot closer as I thought. We have an average difference of just 0.05% between measured and calculated values. Only 3 data points have a difference > 0.06%. Unfortunately these three contain two of the most influential data points. The point for 104 CP is worst. This isn’t surprising as it is the most difficult one to get right.
Nearly as bad is CP 2315 – I guess my Pokemon got kicked early and I didn’t redo this data point. But more importantly – there is a large gap in data between 104 and 741 CP – therefore there is no chance to determine that the algorithm is discontinuous.
Here is the match for my generation 2 data.
| CP | Decay/hour | Decay calc. | T(max) | T(max) calc |
| 103 | 1.01% | 1.11% | 79.21 | 72.00 |
| 149 | 1.08% | 1.11% | 74.07 | 72.00 |
| 501 | 1.46% | 1.43% | 54.65 | 55.96 |
| 741 | 1.89% | 1.83% | 42.34 | 43.72 |
| 1010 | 2.38% | 2.35% | 33.67 | 34.04 |
| 1269 | 3.02% | 2.97% | 26.50 | 26.90 |
| 1281 | 2.97% | 3.01% | 26.97 | 26.61 |
| 1282 | 2.96% | 3.01% | 27.03 | 26.58 |
| 1385 | 3.37% | 3.31% | 23.76 | 24.17 |
| 1611 | 4.10% | 4.12% | 19.53 | 19.44 |
| 1644 | 4.26% | 4.25% | 18.79 | 18.81 |
| 1651 | 4.29% | 4.28% | 18.67 | 18.67 |
| 1737 | 4.68% | 4.68% | 17.09 | 17.08 |
| 1830 | 5.03% | 5.18% | 15.91 | 15.45 |
| 1842 | 5.35% | 5.25% | 14.95 | 15.25 |
| 1850 | 5.24% | 5.29% | 15.26 | 15.11 |
| 1998 | 6.31% | 6.30% | 12.69 | 12.71 |
| 2012 | 6.39% | 6.41% | 12.52 | 12.49 |
| 2128 | 7.61% | 7.45% | 10.51 | 10.74 |
| 2206 | 8.32% | 8.32% | 9.61 | 9.61 |
| 2228 | 8.62% | 8.60% | 9.28 | 9.30 |
| 2271 | 9.24% | 9.19% | 8.66 | 8.70 |
| 2304 | 9.54% | 9.70% | 8.39 | 8.25 |
And in graphic format
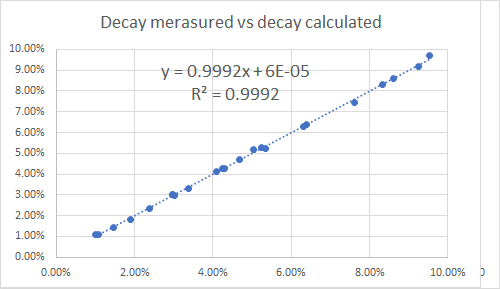
Looking back is interesting. It seems I reused some generation 1 data while removing the two most misleading values as I must have been aware of the limited quality of them. I also add a high quality data point around 500 CP and try to get accurate data for 149 CP and 103 CP. Unfortunately the latter seems deceivingly like 1% – and I never bothered to fill the gap between 300 CP and 500 CP.
The average difference between calculated and measured is 0.05% again. I don’t think we can expect any more – knowing how I generated my original data.